I cleaned and prepared a messy layoff dataset using SQL by removing duplicates, standardizing formats, handling missing values, and converting dates. The result is a clean, structured table ready for analysis and visualization.
I explored a cleaned layoff dataset using SQL to uncover trends and insights. I analyzed layoffs by company, country, year, and funding stage, calculated averages and rolling totals, and ranked top companies by impact. This helped visualize patterns in workforce reductions across time and industries.
I built an Amazon web scraper using Python to extract product details like titles, prices, and availability in real time. It uses requests and BeautifulSoup to parse HTML and collect data, with optional automation using schedule or time. This project helps track price changes efficiently for analysis or alerts.

I conducted Exploratory Data Analysis using Pandas, NumPy, Seaborn, and Matplotlib to explore and visualize data. I used statistical summaries, correlation heatmaps, and distribution plots to uncover patterns, detect outliers, and understand relationships between variables—laying the groundwork for deeper analysis and modeling.

I built an Automatic File Sorter in Python that watches a folder and instantly organizes files into neat, categorized folders based on type—no more messy desktops or Downloads chaos. It runs quietly in the background, keeping everything sorted without me lifting a finger.
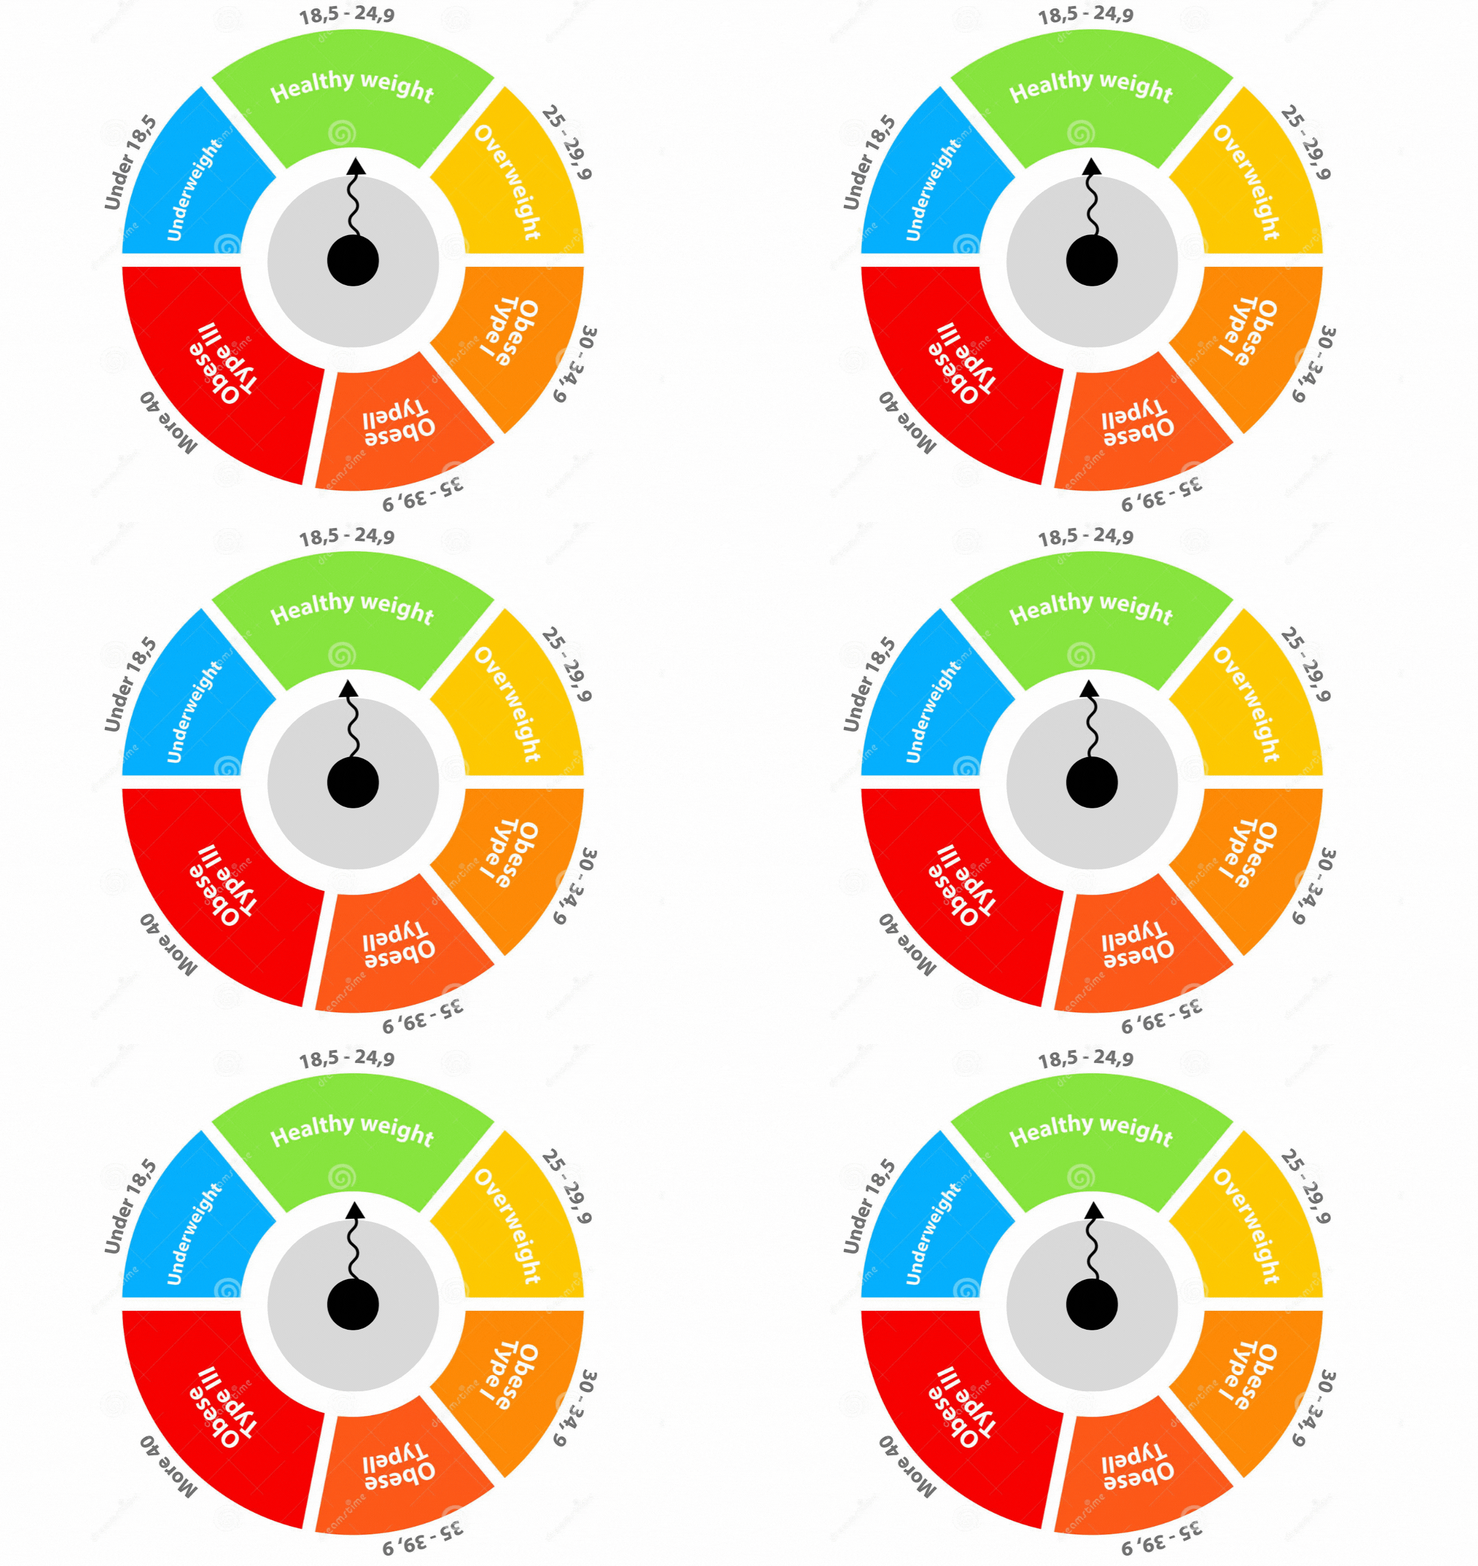
I created a simple Python-based BMI Calculator that takes a user’s height and weight, calculates their Body Mass Index, and provides personalized feedback on their health category. It’s a quick, interactive tool that makes understanding BMI easy and accessible.


